Arizona Wastewater Surveillance for SARS-CoV-2

It has been known for some time that people infected with SARS-CoV-2 can shed the virus in their feces, even if they don’t have symptoms. Wastewater can be analyzed for presence of the virus much in the same way nose swabs or spit samples are analyzed.
The advantage of this kind of surveillance, according to the CDC, is that—unlike case rates that are typically reported—wastewater testing "does not depend on people having access to healthcare, people seeking healthcare when sick, or availability of COVID-19 testing." It also covers large numbers of people. It is therefore a good early warning indicator and one epidemiologists use to get a more accurate picture of how prevalent the virus is in a community.
We could use a good early warning indicator now that our leaders have eaten the marshmallow and scaled back their pandemic reporting to weekly. So I decided to take a look at wastewater surveillance in Arizona. Predictably, we are doing a half-assed job.
The CDC has a dashboard/tracker for wastewater surveillance (which FYI seems not to work in Chrome but does in Firefox). In the Arizona section we find that only Pima, LaPaz, and Mohave counties report numbers. I don't put a lot of stock in the LaPaz and Mohave numbers since those counties are largely rural and people are less likely to be connected to sewer systems.
But Pima County is a different matter because it includes Tucson. They analyze samples from two "sewersheds" in Pima County that get reported to CDC. One of them seems only to have started reporting numbers in late February. The chart below contains an average across both sewersheds where data for two are available:

The CDC reports this data daily, but it seems that the Pima County numbers may not be added that often, leading to repeat values in the chart above. Values shown are the percent change over two weeks. So as we can see, from mid to late February levels were dropping. Since then they have continued dropping, though not by as much.
Why the state's largest county, Maricopa, is not doing this surveillance is a mystery to me. Seems like if you want it anywhere, it is here since the county accounts for more than 60% of the state's population.
The best we can do in Maricopa County is to look at the data from Tempe. Rather than reporting percent change, they give data about copies of the genome per liter of wastewater.
Tempe reports results weekly from seven sewersheds. I averaged across these values to get the chart below. Note that they have a floor value of 5000 copies/liter, below which they say results are unreliable. So the lowest a value on this chart could ever go is 5000.
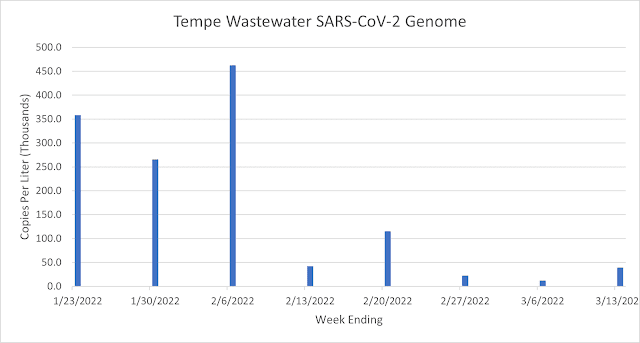
Anyway, this is much the same story as Pima county. Big drops through February, with levels coming back up a little as of last week. Let's hope this is not an early indicator of a new wave.
Gong forward I will be incorporating these values into the weekly numbers summary on Thursdays.