AZ Pandemic Numbers Summary for the Week Ending February 19: Are Declines Bottoming Out?


This week everything is going in the right direction, even deaths for the first time in a long time. The only red numbers are from deaths over the last month and Arizona rank among states in vaccinations. The deaths aren't surprising since as noted before those lag infections. The rank has been dithering for some time now.
One slightly discouraging thing is that the decrease in cases seems to be bottoming-out. Both state and county rates declined by 28 over the last week, but the previous week they declined by over 60, and the week before that by around 90.
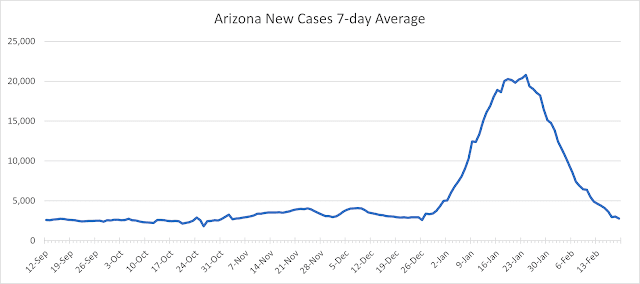
The new cases graph seems to be leveling off too. Hopefully it will continue moving downward. We are still at a little more than double the case rate of last spring.
The decline in new hospital beds may be leveling off too, according to the dual-axis graph. As with last week, decline in news deaths is lagging the decline in cases.


* Unless otherwise noted, data are retrieved from the ASU Biodesign Dashboard


