AZ Pandemic in Numbers for the Week Ending Jan 30
Here are the numbers for the week just ended:
All the numbers are headed in the right direction, and the one-week and four-week change are both negative, indicating that we're over a hump. The one-week increase in vaccinations last week was 1.58%, whereas this week it's 2.58%, indicating that we are picking up the pace on that front.
You might remember that last week there was concern that different numbers weren't adding up. For example, some hospital stats were still increasing even though new cases were falling.
More Reliable
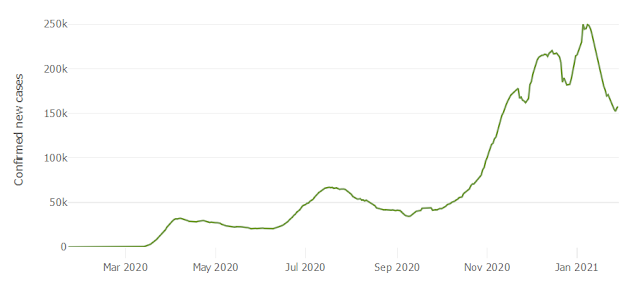
This week, there is more confidence that the downward trend is genuine. Hospital usage is trending down (although utilization remains high). New cases per 100K 7-day average is trending down for every county except Apache and Graham. As noted in an earlier post, those counties contain reservations, which have been getting hammered since summer.
Variance is decreasing on several of the measures too. Here is positive test percent for that last two months:
There are clearly fewer daily observations (Xs) that deviate a lot from the 7-day average (maroon line). They are tracking the average more closely, especially over the last week.National Trend
Update 2/21/21
The data table was updated to
correct a calculation error in statewide new cases.
Image by Shutterbug75 from Pixabay


