Posts

Another One Bites the Dust

Image
Hi all. Stepping out of retirement for a moment to say that the day has finally arrived. After four years of successfully avoiding COVID-19 infection I had a positive test yesterday. Symptoms are very mild—I've had worse colds. The provider at urgent care said almost all the cases they are seeing are the same. Mild symptoms may also be due to the fact that I had the original vaccine then the two boosters. All this time I thought I might be a NOVID —one of those people who never get the bug. But no, it must have been my assiduous mask wearing and avoidance of high-risk situations when things were bad. So here's double middle fingers to all the kooks who think masks don't work (I've not been wearing masks for months now). I don't know what variant I have but it's likely JN.1. It is said to be extraordinarily contagious and accounts for 60% of cases worldwide . It also tends to produce mild infections like the one I have.  This article claims that right now every...

AZ Pandemic Numbers Summary for the Seven Days Ending May 10: This is the Last of These Updates

Image
  Here are the Arizona pandemic numbers and graph of statewide cases for the seven day period ending Wednesday: Everything is looking good, except a 29% increase in COVID-19 hospital beds. That is still within what has been normal variation since the beginning of the year, so nothing to get too excited about.  Deaths are up, but those numbers from from AzHDS, which  as we know  does not have reliable reporting practices. Given all of this, and given that the COVID-19 public health emergency ended yesterday , this is a good time to end these updates and retire the blog. I will continue to keep an eye on numbers and restart if it looks like a new wave is brewing, but I hope that is not necessary. Some of you have posted comments on the AZ Coronavirus  subreddit  saying you found these updates helpful for knowing when to take precautions. I'm happy to know this, because it has taken some work!   If you want to monitor things on your own going forward...

AZ Pandemic Numbers Summary for the Seven Days Ending May 3: Things Look Pretty Stable

Image
  Here are the Arizona pandemic numbers and graph of statewide cases for the seven day period ending Wednesday: Everything is looking pretty good. Some of the wastewater signals are up, but all of the direct indicators are down. That 20% increase in state cases last week turned into a 17% decrease this week so it was indeed another reporting anomaly. Maricopa County didn't update today like usual so those numbers are from last Friday. Likewise the Pima County wastewater numbers are stale.

AZ Pandemic Numbers Summary for the Seven Days Ending April 26: Looks Like Another State Cases Anomaly

Image
  Here are the Arizona pandemic numbers and graph of statewide cases for the seven day period ending Wednesday: AzDHS case numbers are 17.5% higher than last week. But given that everything else shows a decrease, I will go out on a limb and say this is probably another reporting snafu where they found a bunch of old cases and threw them in this week's hopper. I suspected the same was true for deaths last week, which spiked by 125%. Sure enough, they decreased by 70% this week and are back down to the same place they have been for quite some time. It's hard to understand why they do this. The whole point of weekly reporting is to get an idea of what is happening in the short term. Throwing in old cases does nothing but generate noise.  The only other news is that, like last week, Tempe again did not maintain its ten day wastewater reporting lag. If we're looking at a consistent 17 day lag now, what's the point in publishing it at all? We don't need to know what condi...

AZ Pandemic Numbers Summary for the Seven Days Ending April 19: Continued Dithering

Image
Here are the Arizona pandemic numbers and graph of statewide cases for the seven day period ending Wednesday: Last week I was a little concerned we might be getting into something again because everything was up. But this week we're back to a mix of small increases and small decreases.  The exception to that is deaths, which are up a lot. Most likely, though, this is due to AzDHS reporting anomalies as we have seen it before. Once again Tempe has failed to update their wastewater dashboard. I should be able to get the missing data next time.

AZ Pandemic Numbers Summary for the Seven Days Ending April 12: One Week Change Going the Wrong Direction for Everything

Image
  Here are the Arizona pandemic numbers and graph of statewide cases for the seven day period ending Wednesday: Well gee, I was really enjoying the sea of green last week. Now it looks like a red tide! Nothing to get alarmed about as a one-week change. None of the changes are big except Tempe and Yavapai wastewater.  That kink at the end of the case graph is a little concerning. We'll see what happens next week. Previous Posts You May Have Missed: New "Arcturus" COVID-19 Strain Surging in India: Here We Go Again?

New "Arcturus" COVID-19 Strain Surging in India: Here We Go Again?

Image
  Welp, there's a newer, worser COVID-19 strain in the wild, y'all. I've been wondering why it's been so long since we've seen news of a threatening new variant.  They are calling this one "Arcturus." The name, according to Wikipedia , means "guardian of the bear." That doesn't make a whole lot of sense to me, but then again I'm not a Greek mythology nerd.  Anyway, this variant is another of the Sons of Omicron. It descended from XBB, and has the designation XBB.1.16.  Another such descendant, XBB.1.5, is currently the king of the hill in Arizona, according to Lim Lab . XBB and its descendants are dominant nationwide, according to BioBot . According to The Independent , Arcturus was first detected in January. It is now spreading in like wildfire in India.  Like all the Sons of Omicron, this variant is "the most contagious yet," but has relatively low disease severity. One point of concern is that officials believe an "infa...

AZ Pandemic Numbers Summary for the Seven Days Ending April 5: A Sea of Green

Image
  Here are the Arizona pandemic numbers and graph of statewide cases for the seven day period ending Wednesday: Very nice looking numbers this week, y'all! Everything down except a couple wastewater signals and a small increase in deaths over the month.  Cases appear to be stabilizing at a floor that has been established over the last year. Of course this is the time last year where we experienced those floor rates only to begin a pretty good climb in April. We shall see what happens.

AZ Pandemic Numbers Summary for the Seven Days Ending March 29: Small Increases & Decreases

Image
  Here are the Arizona pandemic numbers and graph of statewide cases for the seven day period ending Wednesday: Another week without much to get excited about. Except for Yavapai County wastewater, the values that increased look like a large percentage increase but were based on a small number from last week to begin with.  Real levels remain low for everything. This is especially obvious when comparing them to the maximums I've recorded since the winter/spring 2022 wave.

AZ Pandemic Numbers Summary for the Seven Days Ending March 22: Everything Down Except Yavapai WW

Image
  Here are the Arizona pandemic numbers and graph of statewide cases for the seven day period ending Wednesday: Well these are pretty good looking numbers. Everything is down except hospital beds over four weeks (it is down over a week though) and Yavapai County wastewater. Not sure what's going on up in the Prescott area. They have almost tripled wastewater readings over the last month, and they are almost triple the next highest county (Pima).  As I've noted before, there are a lot of COVIDiots up there. Even at the height of the pandemic few people wore masks. Also their overall vaccination rates are around 10% lower than Maricopa County. 

AZ Pandemic Numbers Summary for the Seven Days Ending March 15: Mixed Bag

Image
  Here are the Arizona pandemic numbers and graph of statewide cases for the seven day period ending Wednesday: This week's numbers are a mixed bag. Cases are down a little in Maricopa County and up a little more statewide. Hospital beds are up a little. Deaths increased 115%, but I'm calling B.S. on that one. Probably another stale data dump from AzDHS. We will see next week. All the wastewater signals are down except Yavapai County. We don't know what the level is in Tempe because once again they are late updating their dashboard . [Updated on 3/17 with Tempe data] After last week's summary, there was some discussion on  Reddit CoronavirusAZ  about wastewater numbers. I mentioned that they didn't always seem to me to track the other indicators, and I said I would investigate I have 47 weeks of data that include wastewater levels. The areas included in that have expanded over time so I just calculated the average of whatever numbers I had for a given week and plott...

R.I.P. and Thanks Johns Hopkins Coronavirus Resource Center

Image
As of last Friday, Johns Hopkins University pulled the plug on its popular Coronavirus Resource Center . The site ran for just over three years, and was an interdisciplinary collaboration between JHU's Applied Physics Laboratory, the Bloomberg School of Public Health, the Center for Systems Science and Engineering in the Whiting School of Engineering, the School of Medicine, Sheridan Libraries, and the Bloomberg Center for Government Excellence. The World Economic Forum called the site "One of the most vital and trusted resources in the fight against the spread of COVID-19." Astonishingly, it was viewed more than  2.5 billion times . This blog accounted for a few of those visits, and you'll find it linked several times in previous posts. It was an important resource for my reporting. They are closing the site because vaccines have reduced the risk of death, and because reliable public health data was becoming increasingly hard to get at the global scale the dashboa...

AZ Pandemic Numbers Summary for the Seven Days Ending March 8: Numbers Continue to Dither

Image
  Here are the Arizona pandemic numbers and graph of statewide cases for the seven day period ending Wednesday: Things look pretty good this week. Cases and deaths are lower. Things that are up are only up a little. The only exception to this is Yavapai County wastewater.  A couple weeks ago I was worried about another upward trend, but I don't see much evidence of it at this point. Overall it looks like the numbers are dithering around some kind of floor, as can be seen in the case graph. Good numbers to get for parents going into spring break!

AZ Pandemic Numbers Summary for the Seven Days Ending March 1: Last Week Case Jumps Were Not All Reporting Anomaly

Image
  Here are the Arizona pandemic numbers and graph of statewide cases for the seven day period ending Wednesday: Welp, remember last week's report when the thinking was the huge jump in cases was due to a dump of stale data from 2022?  It was, but not completely.  For the case graph this week I replaced last week's anomalous value with the average of this week and two weeks ago (this is called imputation ). As you can see, there is an upward trend so there were likely some "real" increased cases last week.  Hospital beds are up, as are almost all the wastewater readings. So I'm guessing that there is some sort of increase going on. Increases are still modest week-over-week. We will have to see if it gains steam next week before we think about declaring a new wave. Previous posts you may have missed: Did SARS-CoV-2 Leak from a Chinese Lab? Maybe, Maybe Not Virus Coming-in on International Flights Says Captain Obvious Bret Stephens Misrepresents Study to Claim Anti-...

The SARS-CoV-2 Leak from a Chinese Lab? Maybe, Maybe Not

Image
  Over the weekend, the Department of Energy changed its assessment of the origin of the pandemic. It had said the origin was inconclusive, but now according to an article in the Times   the agency now thinks  it was a lab leak from a Wuhan lab. The change was based on new intelligence (they won't say what) that "was relatively weak and that the Energy Department’s conclusion was made with 'low confidence,' suggesting its level of certainty was not high." DOE shared the same info with other agencies, none of which changed their assessments. The article outlines the diverging views among different intelligence agencies: In addition to the Energy Department, the F.B.I. has also concluded, with moderate confidence, that the virus first emerged accidentally from the Wuhan Institute of Virology, a Chinese lab that worked on coronaviruses. Four other intelligence agencies and the National Intelligence Council have concluded, with low confidence, that the virus most...

Virus Coming-in on International Flights Says Captain Obvious

Image
  I've been a fan of wastewater surveillance for SARS-CoV-2. I have blogged about it , and have included figures in the weekly summary for some time now. To review, the virus shows up in wastewater because when people are infected they shed virus in their feces, so it's present in wastewater systems and samples from those systems can be used to estimate population level spread. It's a great public health method because it's 100% anonymous and can cover large groups of people without needing them to do anything except what comes naturally. The CDC recently decided to try the technique to see if they could detect virus incoming on international flights. They tested 80 international flights incoming to JFK International Airport in New York. Guess what? They were able to detect virus in 81% of the samples! It worked! Well, we know we can detect virus in wastewater and planes contain wastewater. Why did we need  this study  to prove we can detect virus in airplane wastewate...

AZ Pandemic Numbers Summary for the Seven Days Ending February 22: Don't Be Alarmed

Image
Here are the Arizona pandemic numbers and graph of statewide cases for the seven day period ending Wednesday: Well! Remember a couple of weeks ago when I wondered whether Superbowl visitors would bring in a new wave of COVID-19? It looks like we could have an answer, if the case numbers are to be trusted. As it turns out, they are not to be trusted. I checked with Will Humble who knows about these things. He says almost all the new cases this week are due to a dump of stale data from 2022. I really don't understand this. What is the point of reporting these cases if they're not current?!  Anyway, we will find out if this was an anomaly next week. Previous posts you may have missed: Bret Stephens Misrepresents Study to Claim Anti-maskers are Owed an Apology Extracts of Two Plants Shown to Block SARS-CoV-2 Spike Protein Mechanism

Bret Stephens Misrepresents Study to Claim Anti-maskers are Owed an Apology

Image
  On Tuesday NY Times Columnist Bret Stephens ran an op-ed  where he dripped contempt for people who said masks work. He thinks we all owe him and other anti-maskers a big fat apology. He cites a new review of scientific literature as evidence that masks really don't work. He quotes one of the study's authors (an epidemiologist who I suppose he interviewed) as saying there is no evidence that masks work, and no evidence that hand washing and air filtration work either. He then whines about how badly the anti-maskers were treated when they were right all along. No mention of poor treatment of pro-maskers. I guess it's OK since they were wrong all along? Here's the thing. Look at the "plain language summary" written by the authors of the   actual study :  We are uncertain whether wearing masks or N95/P2 respirators helps to slow the spread of respiratory viruses based on the studies we assessed. Hand hygiene programmes may help to slow the spread of respiratory ...

Extracts of Two Plants Shown to Block SARS-CoV-2 Spike Protein Mechanism

Image
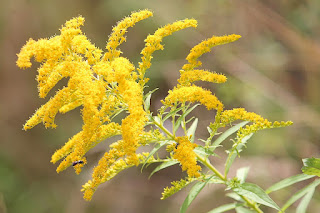
I don't know about you, but just looking at that picture makes me want to sneeze! But it turns out it has promise as something more than an annoying fall allergen. Last month Emory University researchers published a study outlining their efforts to screen botanical agents to find any that have a protective effects against SARS-CoV-2. They scored hits with two extracts, one from the flowers of tall goldenrod (Solidago altissima) and another from the rhizomes of the eagle fern (Pteridium aquilinum). To find them, scientists attached SARS-CoV-2 spike proteins to a payload that would make cells fluoresce. This provided a visual marker of when a cell had been penetrated.  They then mixed these "virus-like particles" with specially engineered cells and various extracts from the Quave Natural Product Library. It contains thousands of botanical and fungal natural products extracted from plants collected at sites around the world. They looked for cases where few cells were lit u...

AZ Pandemic Numbers Summary for the Seven Days Ending February 15: Most Measures Increase an Average 20%

Image
  Here are the Arizona pandemic numbers and graph of statewide cases for the seven day period ending Wednesday: Most numbers are up and the changes average +20%. These are increases are small in absolute terms because they are a percent increase on an already-small number. Nonetheless we'd prefer to see the numbers going in the other direction. The good news is that hospitalizations are continuing a downtrend. That is our most reliable indicator of serious illness.  I don't know what is going on with Tempe. Maybe they're updating their wastewater numbers only every other week now? January 29 was the latest data both last week and this week. I have reset the scale of the y-axis on the case graph to a more reasonable range now that the past year no longer includes the January 2022 peak. We are at approximately the same lows as we saw last April and October. At those times the line did not stay flat for as long as it has recently. Previous posts you may have missed: An...